Exporter
Prometheus 通过Metrics接口为其提供监控指标,最好的方式就是直接在目标应用中集成该接口,但是有些应用并没有内置支持metrics接口,比如Linux系统,MySQL,Redis,Kafka等应用,这种情况下我们就可以单独开发一个应用来专门提供metrics服务,广义上讲所有可以向Prometheus提供监控样数据的程序都可以被称为Exporter,Exporter的一个实例就是我们要监控的Target
Prometheus社区提供了非常的丰富的Exporter,涵盖了基础设施,中间件以及网络等各个方面的监控实现,当然了社区也会出现很多的其他的Exporter,如果有必要,我们也可以完全g根据自己的需求开发一个Exporter,但是最好以官方的Exporter为最佳实践
下载地址:https://prometheus.io/download/
1:数据库:Consul Exporter,Memcached Exporter,MySQL Exporter 2:硬件相关:Node/system metrics exporter 3:HTTP:Haproxy Exporter 4:其他监控系统:AWS CloudWatch Exporter,Colletcd Exporter,Graphite Exporter,InfluxDB Exporter,JMX Exporter,SNMP Exporter,StatsD Exporter,Blackbox Exporter......
由于 Exporter 是提供监控指标的独立服务,所以我们需要单独的部署该服务来提供指标服务,比如:Node Exporter 就需要在操作系统上独立运行来收集系统相关监控数据转换为 Prometheus 能够识别的 metrics 接口
# Node Exporter
由于Node Exporter是一个独立的二进制程序,可以直接从Prometheus官网下载解压
https://github.com/prometheus/node_exporter/releases/download/v1.8.2/node_exporter-1.8.2.linux-amd64.tar.gz

[root@localhost exporter]# tar xf node_exporter-1.8.2.linux-amd64.tar.gz

[root@localhost exporter]# cd node_exporter-1.8.2.linux-amd64/

[root@localhost node_exporter-1.8.2.linux-amd64]# ls
LICENSE  node_exporter  NOTICE

[root@localhost node_exporter-1.8.2.linux-amd64]# ./node_exporter  --version
node_exporter, version 1.8.2 (branch: HEAD, revision: f1e0e8360aa60b6cb5e5cc1560bed348fc2c1895)
  build user:       root@03d440803209
  build date:       20240714-11:53:45
  go version:       go1.22.5
  platform:         linux/amd64
  tags:             unknown

[root@localhost node_exporter-1.8.2.linux-amd64]# nohup ./node_exporter &
[1] 126897
[root@localhost node_exporter-1.8.2.linux-amd64]# nohup: 忽略输入并把输出追加到"nohup.out"

[root@localhost node_exporter-1.8.2.linux-amd64]# tail -n4 nohup.out
ts=2024-12-24T02:45:55.866Z caller=node_exporter.go:118 level=info collector=xfs
ts=2024-12-24T02:45:55.866Z caller=node_exporter.go:118 level=info collector=zfs
ts=2024-12-24T02:45:55.868Z caller=tls_config.go:313 level=info msg="Listening on" address=[::]:9100
ts=2024-12-24T02:45:55.868Z caller=tls_config.go:316 level=info msg="TLS is disabled." http2=false address=[::]:9100

[root@localhost node_exporter-1.8.2.linux-amd64]# curl -o /dev/null -s -w "%{http_code}" localhost:9100
200
2
3
4
5
6
7
8
9
10
11
12
13
14
15
16
17
18
19
20
21
22
23
24
25
26
27
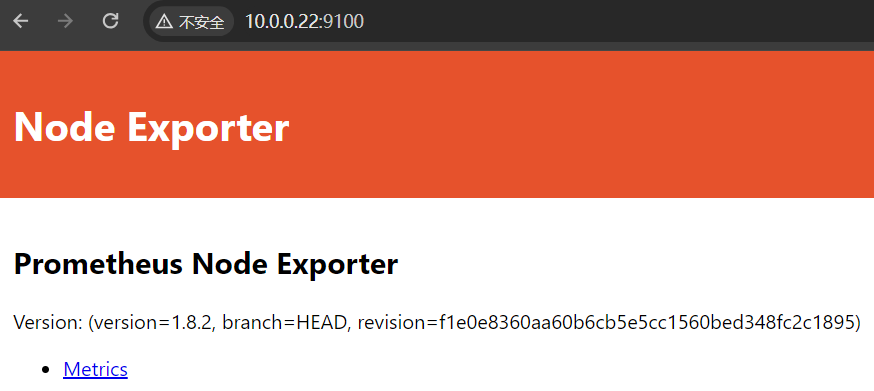
他告诉我们要去访问 /metrics 路径才会有数据
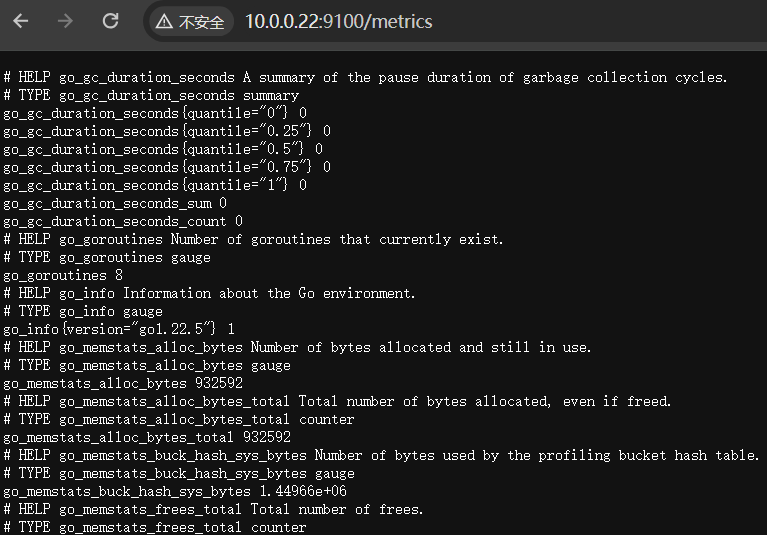
在这里我们就看到我们熟悉的数据啦,但是我们其实还有很多关于 exporter 有很多可配置的地方,我们可以 -h 来看一下
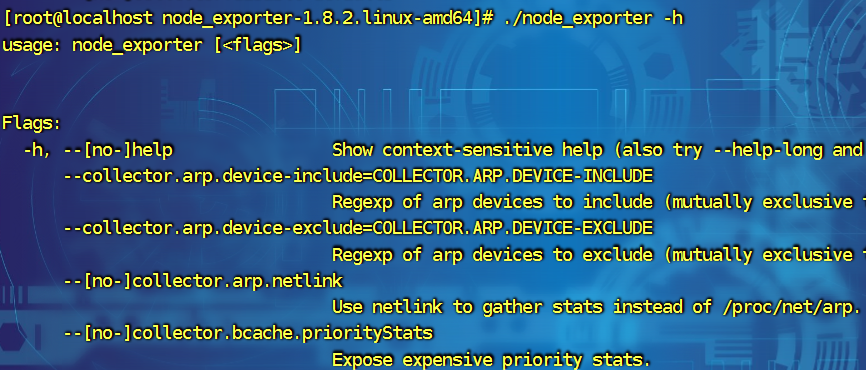
比如我们想禁用一个收集比如arp:./node_exporter --no-collector.arp(这样关于ARP的收集器就被关闭了)
那如果有人说我只想启动其中的某一个或者几个功能怎么办呢?当然了它也有解决方法
./node_exporter --collector.disable-defaults --collector.cpu
- --collector.disable-defaults # 默认禁用所有的采集器
- --collector.cpu # 只开启CPU的采集器
配置 Exporter(使用 systemd 管理)
[root@localhost node_exporter-1.8.2.linux-amd64]# mv node_exporter /usr/local/bin/
[root@localhost node_exporter-1.8.2.linux-amd64]# cat << EOF > /etc/systemd/system/node_exporter.service
> [Unit]
> Description=node exporter service
> Documentation=https://prometheus.io
> After=network.target
>
> [Service]
> Type=simple
> User=root
> Group=root
> ExecStart=/usr/local/bin/node_exporter
> Restart=on-failure
>
> [Install]
> WantedBy=multi-user.target
> EOF
[root@localhost node_exporter-1.8.2.linux-amd64]# systemctl start node_exporter.service
[root@localhost node_exporter-1.8.2.linux-amd64]# systemctl status node_exporter.service
node_exporter.service - node exporter service
Loaded: loaded (/etc/systemd/system/node_exporter.service; disabled)
Active: active (running) since 二 2024-12-24 11:30:47 CST; 2s ago
Docs: https://prometheus.io
Main PID: 77786 (node_exporter)
CGroup: /system.slice/node_exporter.service
└─77786 /usr/local/bin/node_exporter
Hint: Some lines were ellipsized, use -l to show in full.
[root@localhost node_exporter-1.8.2.linux-amd64]# netstat -tunpl | grep exporter
tcp6 0 0 :::9100 :::* LISTEN 77786/node_exporter
[root@localhost node_exporter-1.8.2.linux-amd64]# systemctl enable node_exporter.service
ln -s '/etc/systemd/system/node_exporter.service' '/etc/systemd/system/multi-user.target.wants/node_exporter.service'
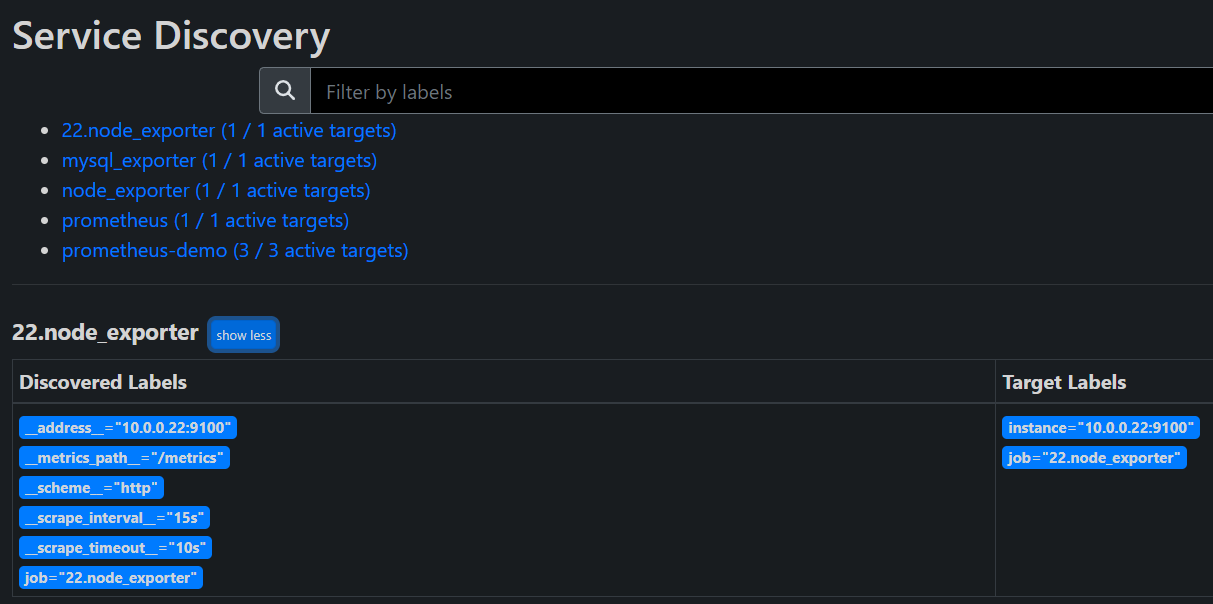
# 修改 Prometheus 配置文件
- job_name: "22.node_exporter"
static_configs:
- targets: ["10.0.0.22:9100"]
# 重新启动 Prometheus
2
3
4
5
6
7
8
9
10
11
12
13
14
15
16
17
18
19
20
21
22
23
24
25
26
27
28
29
30
31
32
33
34
35
36
37
38
39
40
41
42
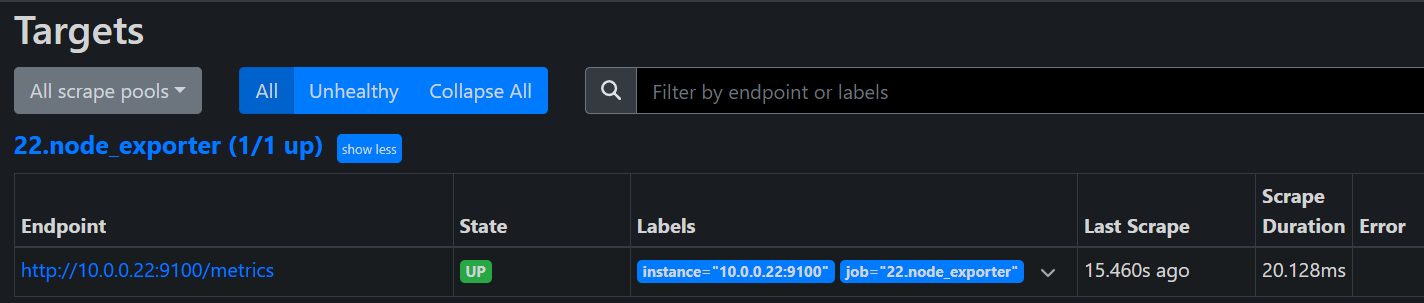
到这里我们就配置好了我们的 Exporter 了,接下来我们来学习的就是 node_exporter 的常用配置
# Node_Exporter 常用监控指标
CPU 监控
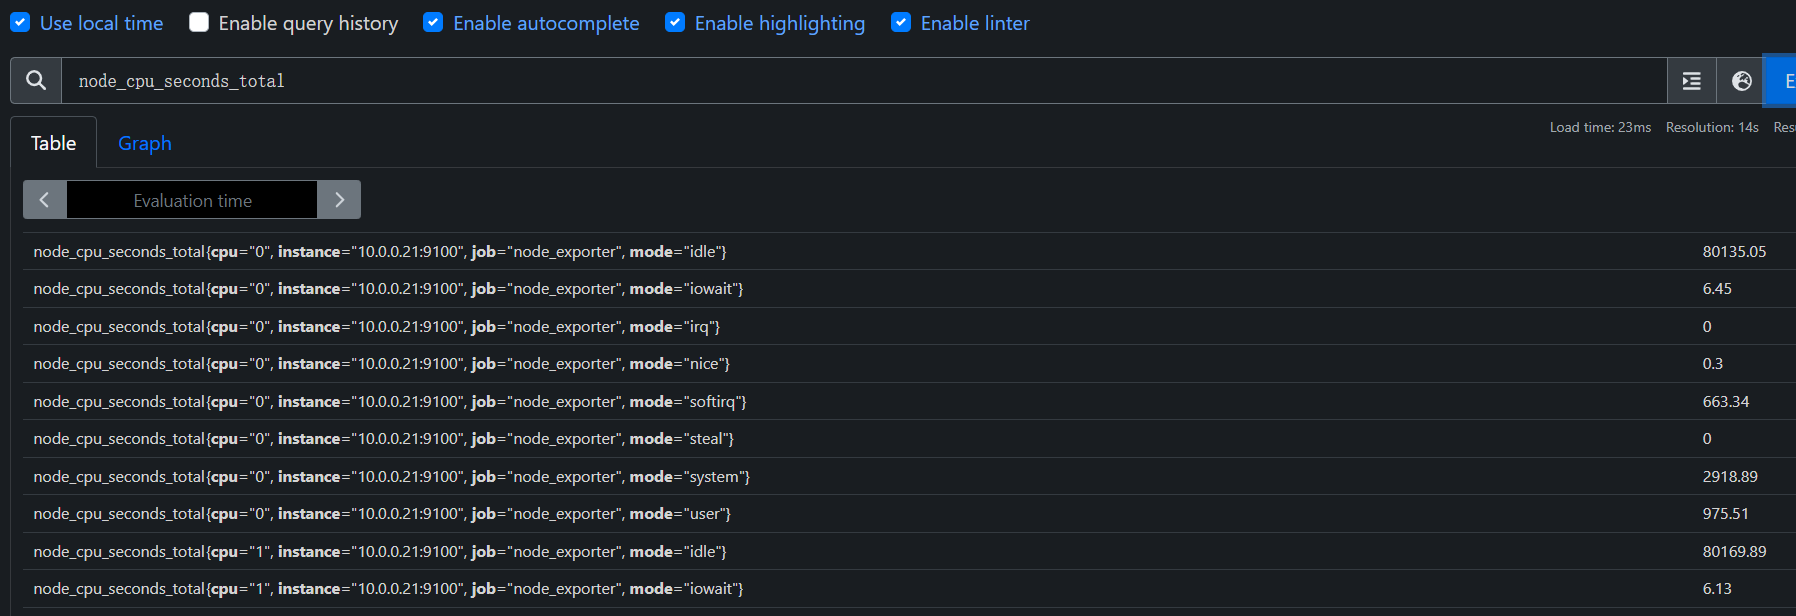
对于节点我们首先想到的就是要先对CPU进行监控,因为CPU是处理任何任务的核心,根据CPU的状态可以分析出当前系统的健康状态,要对节点进行CPU监控,需要用到node_cpu_seconds_total这个监控指标,在metrics接口中该指标内容如下
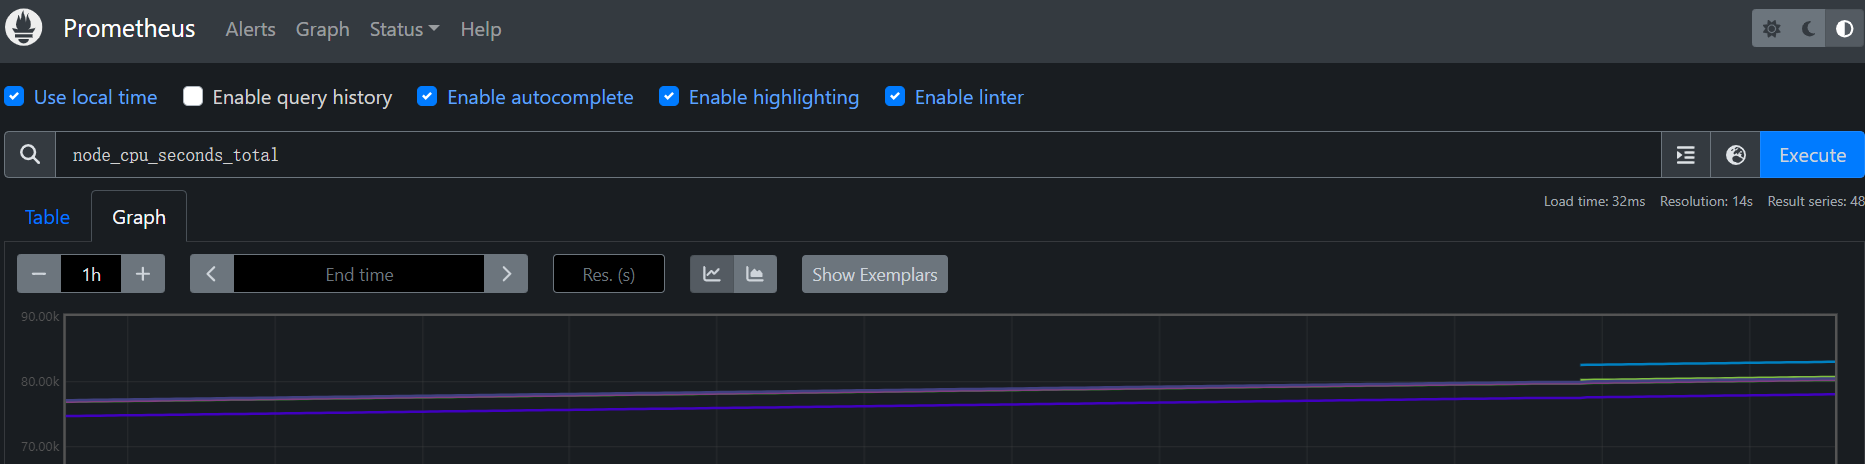
PromQL:node_cpu_seconds_total
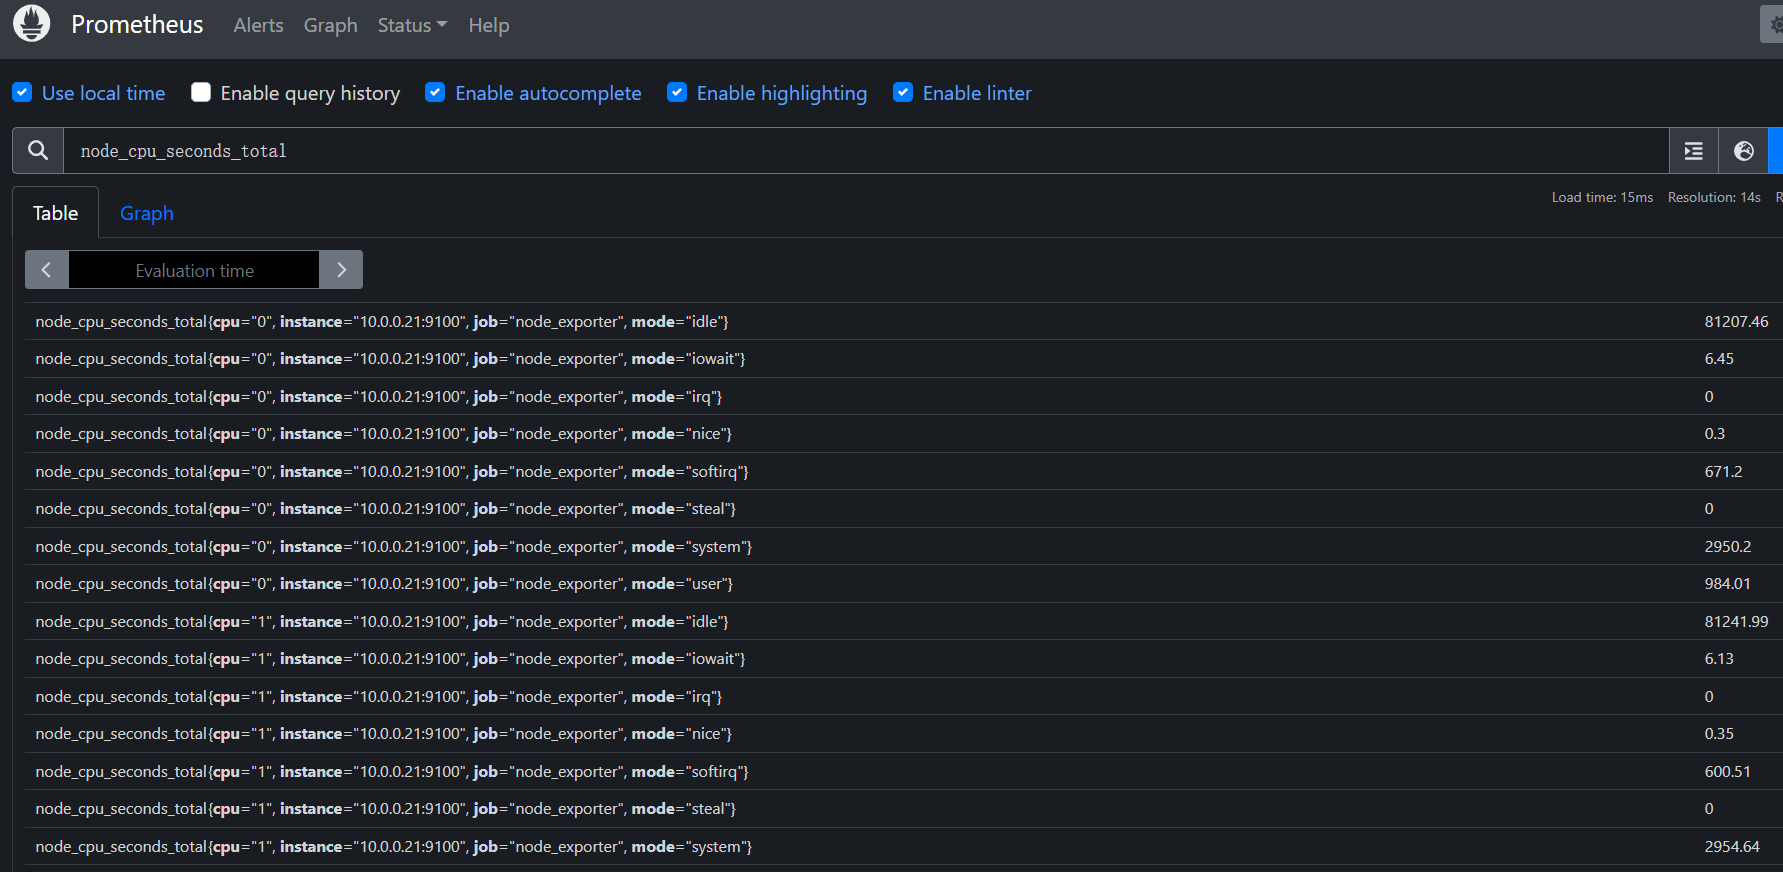
# CPU 主要处于 空闲状态,累计空闲时间约 1,145,139.61 秒
node_cpu_seconds_total{cpu="0",mode="idle"} 1.14513961e+06
# I/O 等待时间为 14.06 秒,表明 I/O 负载很小
node_cpu_seconds_total{cpu="0",mode="iowait"} 14.06
# 没有发生硬件中断和虚拟化管理器抢占(irq 和 steal 均为 0)
node_cpu_seconds_total{cpu="0",mode="irq"} 0
node_cpu_seconds_total{cpu="0",mode="nice"} 1.79
node_cpu_seconds_total{cpu="0",mode="softirq"} 10.4
node_cpu_seconds_total{cpu="0",mode="steal"} 0
# 系统任务时间为 390.77 秒,内核相关任务占用较少的时间
node_cpu_seconds_total{cpu="0",mode="system"} 390.77
# 用户程序执行时间为 137.93 秒,说明 CPU 主要为应用程序工作
node_cpu_seconds_total{cpu="0",mode="user"} 137.93
2
3
4
5
6
7
8
9
10
11
12
13
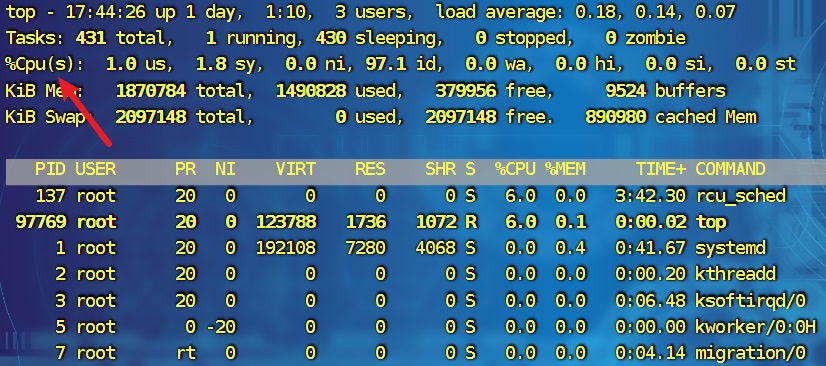
从接口的描述可以看出该指标是用来统计 CPU 每种模式下所花费的时间,是一个 Counter 类型的指标,也就是会一直增长,这个数值其实是CPU 时间片的一个累积值,意思就是从操作系统启动起来 CPU 开始工作,就开始记录自己总共使用的时间,然后保存下来,而且这里累积的CPU 使用时间还会分成几个不同的模式,比如用户态使用时间,空闲时间,中断时间,内核态使用时间等等,也就是平时我们使用 top 命令查看到的相关信息,而且我们这个指标会分别对这些模式进行记录
接下来我们对节点的 CPU 进行监控,我们也知道一个一直增长的 CPU 时间对于我们来说意义不大,一般我们更希望监控节点的 CPU 使用率,也就是我们使用 top 命令看到的百分比
 increase 计算增量值
by(instance):表示将结果按 instance 标签进行分组,比如对 instance1 实例进行计算,instance1 实例有 2 个 CPU 核心,那么就有两个组
sum:表示对查询结果进行求和
计算一分钟内idle模式下cpu使用了多少时间:
PromQL:increase(node_cpu_seconds_total{mode="idle"}[1m])
instance进行聚合一下:
PromQL:sum by(instance)(increase(node_cpu_seconds_total{mode="idle"}[1m]))
与总的CPU时长进行对比:
PromQL:sum (increase(node_cpu_seconds_total{mode="idle"}[1m])) by(instance) / sum (increase(node_cpu_seconds_total[1m])) by(instance)
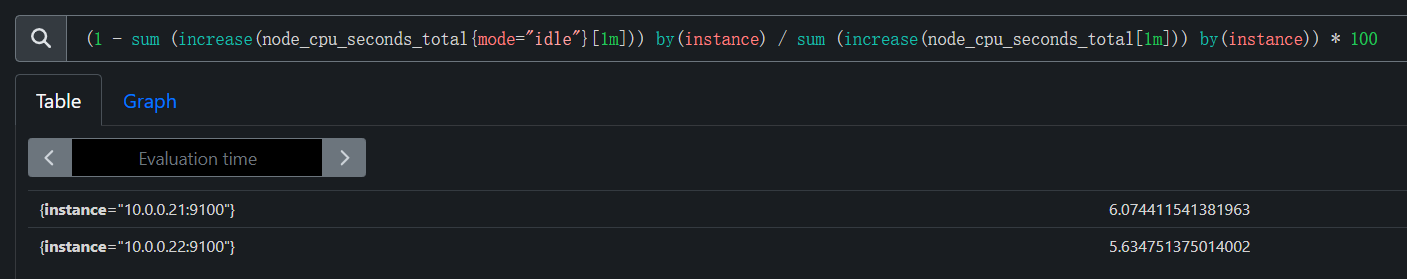
整体PromQL计算如下:
PromQL:(1 - sum (increase(node_cpu_seconds_total{mode="idle"}[1m])) by(instance) / sum (increase(node_cpu_seconds_total[1m])) by(instance)) * 100
2
3
4
5
6
7
8
内存监控
除了 CPU 监控之外,我们可能最关心的就就是节点内存的监控了,平时我们查看节点的内存使用情况基本上都是使用 free 命令来查看
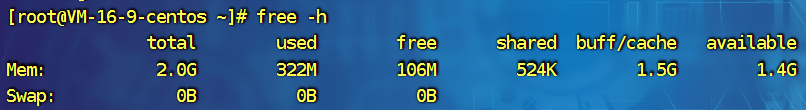 total:表示系统总的可用的内存
used:已经被使用的内存
free:还有多少内存可供是使用
shared:被共享使用的大小
buff/cache:被buff/cache使用的大小
available:可以被应用使用的内存大小
要计算可使用的内存的使用我们需要使用如下(应用程序角度):
PromQL:node_memory_Buffers_bytes + node_memory_Cached_bytes + node_memory_MemFree_bytes
内存使用率计算方法如下:
PromQL:(1 - (node_memory_Buffers_bytes + node_memory_Cached_bytes + node_memory_MemFree_bytes) / node_memory_MemTotal_bytes) * 100
内存总的一个使用情况:
PromQL:node_memory_MemTotal_bytes
2
3
4
5
6
磁盘监控
要监控磁盘容量,需要用到 node_filesystem_* 相关指标,比如要查询节点磁盘空间使用率,则可以同样用总的减去可用的来进行计算,磁盘可用空间使用node_filesystem_avail_bytes指标,但是由于会有一些我们不关心的磁盘信息,所以我们可以使用fstype标签过滤关心的磁盘信息,或如ext4或者xfs格式的磁盘
可用的磁盘空间:
PromQL:node_filesystem_avail_bytes{fstype=~"xfs|ext4"}
计算可用率:
PromQL:node_filesystem_avail_bytes{fstype=~"xfs|ext4"} / node_filesystem_size_bytes{fstype=~"xfs|ext4"} * 100
计算使用率:
PromQL:(1 - node_filesystem_avail_bytes{fstype=~"xfs|ext4"} / node_filesystem_size_bytes{fstype=~"xfs|ext4"}) * 100
当然了我们可以根据各个服务器来查看不同的情况,比如我们查看Prometheus本身的,在过滤时使用标签即可:
PromQL:(1 - node_filesystem_avail_bytes{fstype=~"xfs|ext4",instance="localhost:9100"} / node_filesystem_size_bytes{fstype=~"xfs|ext4",instance="localhost:9100"}) * 100
2
3
4
5
6
7
8
磁盘IO监控
要监控磁盘的IO,那么就要区分是读IO还是写的IO
读的IO使用node_disk_reads_completed_total指标
写的IO使用node_disk_writes_completed_total 指标
磁盘读IO使用如下方法计算
PromQL:sum by(device,instance)(rate(node_disk_reads_completed_total[1d]))
计算写的IO使用方法如下:
PromQL:sum by(device,instance)(rate(node_disk_writes_completed_total[1d]))
2
3
4
网络 IO 监控
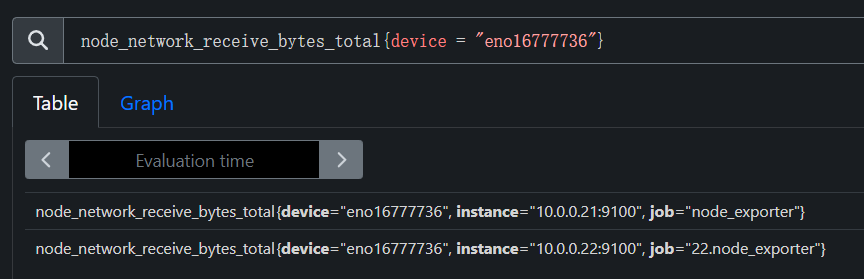
上行带宽使用 node_network_receive_bytes_total,由于我们对网络带宽的瞬间变化比较关注,所以一般我们会使用irate函数计算网络IO,比如计算上行带宽
这里面的话可能涉及到多网卡的情况,所以我这里只使用eth0来计算了,要根据生产的环境来酌情使用
表示网络接口接收的字节数总和,这是一个计数器(counter)类型的指标,随着时间的推移会不断递增
PromQL:node_network_receive_bytes_total{device = "eth0"}
rate() 是 PromQL 中用于计算计数器在指定时间窗口(在这里是 5 分钟 [5m])内的变化速率。对于 node_network_receive_bytes_total 这样的计数器,它返回的是 每秒接收的字节数
PromQL:rate(node_network_receive_bytes_total{device = "eth0"}[5m])
这个查询计算了每个实例(例如每台主机)的 eth0 网络接口的总接收速率。它会将每个实例所有 eth0 网络接口的接收字节数的速率求和,单位是字节/秒(B/s)。如果某台机器有多个网卡接口,sum by(instance) 会将其聚合成总和
PromQL:sum by(instance)(rate(node_network_receive_bytes_total{device = "eth0"}[5m]))
这个查询计算每个实例的 eth0 接口接收的瞬时字节数速率(单位为字节/秒),然后将其转换为兆字节/秒(MB/s)。与 rate() 不同,irate() 计算的是瞬时的变化速率,适合快速响应网络带宽波动
PromQL:sum by(instance)(irate(node_network_receive_bytes_total{device = "eth0"}[5m])) / 1024^2
2
3
4
5
6
7
8
9